Linux Spelunking: How are processes loaded?
Published:
Linux Spelunking: How are processes loaded? How would I figure it out?
Today we journey into Linux to discover how programs are loaded. Building new systems requires understanding how the current system actually works—not how the documentation claims it works. I wrote this post for people who want to learn more about kernel internals but have been hesitating to dive in for themselves; it’s the post I wish I had when starting out. This article aims to convince you that kernel development is not intimidating. We will explore how to deal with ambiguity when researching something new. You will come out with an understanding of the exact actions Linux takes to load a realistic program. Moreover, you will learn the tools to deconstruct any large program.
Goal: How does Linux load a program?
The first thing you may note is that this question is a bit odd. There are several interpretations for what it means to “load a program”. This is a good point. However, a priori, I cannot know what the correct question to ask is. Our expedition begins assuming basic C knowledge and becomes more complex. We will learn about the Linux kernel and its internal mechanisms from scratch.
- Trace Simple Program
- Try decoding thousands of system calls with
straceand discoverprintfis not in the program
- Try decoding thousands of system calls with
- Binary Archaeology
- Crack compiled programs with
objdumpandreadelf - Find a PLT and GOT that are calling nonexistent functions
- Crack compiled programs with
- Shared Libraries
- Explore the loading of
libcand the dynamic linkerld-linux.so
- Explore the loading of
- Kernel Mechanisms
- Follow how
mmap, page faults, and copy-on-write support efficient library sharing
- Follow how
- Piecing the Puzzle
- Connect the path from
execvetomainwith general purpose kernel mechanisms - Entirely understand how Linux brings bytes on disk to life as processes

- Connect the path from
We must step in any direction to start. The results of each experiment will allow us to iterate, refine our questions, and learn new concepts.
On first blush, the question seems obvious. Running a program simply means going to the first instruction and running in order until the end. Let’s test this theory.
Load a program
Let’s try running a simple program and inspect what it is doing. nautilus is the file explorer application that ships with GNOME. We want to know what Linux is doing when nautilus starts. Luckily, there is a tool called strace which records every call into Linux. Before we look at the output, let’s stop to recursively explain what is going on.
: Why Nautilus?
No reason. I wanted a simple program that doesn’t do much.
: How do you know to look at calls into the kernel?
Think about how the way programs run. Starting any process requires notifying the kernel of the program you are starting. These interactions are called syscalls. User programs use these functions to ask the operating system to do something privileged. For example, a process cannot open a file without asking for permission first. You can think of system calls as normal function calls for the purposes of this exercise.
$ strace nautilus
execve("/run/current-system/sw/bin/nautilus", ["nautilus"], 0x7ffe54d428a0 /* 75 vars */) = 0
brk(NULL)                               = 0x30e3a000
--------- 23,744 lines snipped ---------
What was that output??? My terminal gets flooded with nautilus’ tens of thousands of syscalls. I have made a grave mistake. That’s okay, it’s too early to get demoralized. Evidently, my mental model that a program which does not appear to be doing anything is doing nothing is wrong. How can we adjust course to make better progress?
Debugging Process:
load “simple” program ⟶ ❌
Load “Hello World”
Instead, we can write a minimal hello_world.c program to test with1. What happens when the kernel loads this program and prints some text?
#include <stdio.h>

int main(void) {
        printf("hello world!\n");
        return 0;
}
$ gcc hello_world.c
$ ./a.out
hello world!
Aha, we have solved the puzzle! The kernel starts running the instructions of main() and printf is just a function call. Spoiler alert: this is wrong. We still haven’t explained what this printf reference is.
: You said I wouldn’t need any prerequisite knowledge to understand this. I don’t understand these keywords. What is this weird
voidthing?If you haven’t seen this before, you can ignore it for now. It means that the function has no input.
: What is that
\nafter hello world?Wonderful question, though you may not realize it
. Simply, the
\nasksprintfto print a newline. Check out my fork post and the resources onprintfat the end of this post to get closer to what\nactually does.
In fact, if we remove all unfamiliar syntax, the program behaves the same as before.
main() {
        printf("hello world!\n");
}
$ gcc hello_world_skeptic.c
$ ./a.out
hello world!
This time our compiler, gcc, complains with a bunch of warnings:
hello_world.c:1:2: warning: return type defaults to ‘int’ [-Wimplicit-int]
    1 |  main() {
      |  ^~~~
hello_world.c: In function ‘main’:
hello_world.c:2:9: warning: implicit declaration of function ‘printf’ [-Wimplicit-function-declaration]
    2 |         printf("hello world!\n");
      |         ^~~~~~
hello_world.c:1:1: note: include ‘<stdio.h>’ or provide a declaration of ‘printf’
  +++ |+#include <stdio.h>
    1 |  main() {
hello_world.c:2:9: warning: incompatible implicit declaration of built-in function ‘printf’ [-Wbuiltin-declaration-mismatch]
    2 |         printf("hello world!\n");
      |         ^~~~~~
hello_world.c:2:9: note: include ‘<stdio.h>’ or provide a declaration of ‘printf’
Weird. The program runs the same, so why are we getting all these warnings? One line jumps out to me. gcc warns us four times about something to do with the “declaration of ‘printf’”. Before we get ahead of ourselves, allow me to fix these compiler warnings. Fixing these warnings will prevent any weird unrelated issues that interfere with our later debugging results.
Following the error message include ‘<stdio.h>’ or provide a declaration of ‘printf’ tells us precisely how to fix the error. C becomes aware of functions it can link with by using header files. Including stdio.h tells gcc about the definition of printf.
> #include <stdio.h>

> int main() {
        printf("hello world!\n");
>       return 0;
  }
It’s a function call
I claim that printf is not a function call. Let’s either verify or disprove this conclusion. We can run strace on hello_world and save the output to a file “hello_world.strace”.
$ gcc hello_world.c
$ strace -o hello_world.strace ./a.out
strace on this binary returns an overwhelming 45 lines of output, which confirms much more is happening.
Abridged output:
$ strace ./a.out
execve("./a.out", ["./a.out"], 0x7ffc3c8056d0 /* 158 vars */) = 0
brk(NULL)                               = 0x33d6f000
mmap(NULL, 8192, PROT_READ|PROT_WRITE, MAP_PRIVATE|MAP_ANONYMOUS, -1, 0) = 0x7f5e57473000
---------- snipped for clarity ----------
write(1, "hello world!\n", 13)          = 13
exit_group(13)                          = ?
+++ exited with 13 +++
Full output (expand)
$ strace ./a.out
execve("./a.out", ["./a.out"], 0x7ffc3c8056d0 /* 158 vars */) = 0
brk(NULL)                               = 0x33d6f000
mmap(NULL, 8192, PROT_READ|PROT_WRITE, MAP_PRIVATE|MAP_ANONYMOUS, -1, 0) = 0x7f5e57473000
access("/etc/ld-nix.so.preload", R_OK)  = -1 ENOENT (No such file or directory)
openat(AT_FDCWD, "/nix/store/sga46w4h0l00adh433634s7kp724czvn-shell/lib/glibc-hwcaps/x86-64-v4/libc.so.6", O_RDONLY|O_CLOEXEC) = -1 ENOENT (No such file or directory)
newfstatat(AT_FDCWD, "/nix/store/sga46w4h0l00adh433634s7kp724czvn-shell/lib/glibc-hwcaps/x86-64-v4/", 0x7ffc1f6fbf30, 0) = -1 ENOENT (No such file or directory)
openat(AT_FDCWD, "/nix/store/sga46w4h0l00adh433634s7kp724czvn-shell/lib/glibc-hwcaps/x86-64-v3/libc.so.6", O_RDONLY|O_CLOEXEC) = -1 ENOENT (No such file or directory)
newfstatat(AT_FDCWD, "/nix/store/sga46w4h0l00adh433634s7kp724czvn-shell/lib/glibc-hwcaps/x86-64-v3/", 0x7ffc1f6fbf30, 0) = -1 ENOENT (No such file or directory)
openat(AT_FDCWD, "/nix/store/sga46w4h0l00adh433634s7kp724czvn-shell/lib/glibc-hwcaps/x86-64-v2/libc.so.6", O_RDONLY|O_CLOEXEC) = -1 ENOENT (No such file or directory)
newfstatat(AT_FDCWD, "/nix/store/sga46w4h0l00adh433634s7kp724czvn-shell/lib/glibc-hwcaps/x86-64-v2/", 0x7ffc1f6fbf30, 0) = -1 ENOENT (No such file or directory)
openat(AT_FDCWD, "/nix/store/sga46w4h0l00adh433634s7kp724czvn-shell/lib/libc.so.6", O_RDONLY|O_CLOEXEC) = -1 ENOENT (No such file or directory)
newfstatat(AT_FDCWD, "/nix/store/sga46w4h0l00adh433634s7kp724czvn-shell/lib/", 0x7ffc1f6fbf30, 0) = -1 ENOENT (No such file or directory)
openat(AT_FDCWD, "/nix/store/nqb2ns2d1lahnd5ncwmn6k84qfd7vx2k-glibc-2.40-36/lib/glibc-hwcaps/x86-64-v4/libc.so.6", O_RDONLY|O_CLOEXEC) = -1 ENOENT (No such file or directory)
newfstatat(AT_FDCWD, "/nix/store/nqb2ns2d1lahnd5ncwmn6k84qfd7vx2k-glibc-2.40-36/lib/glibc-hwcaps/x86-64-v4/", 0x7ffc1f6fbf30, 0) = -1 ENOENT (No such file or directory)
openat(AT_FDCWD, "/nix/store/nqb2ns2d1lahnd5ncwmn6k84qfd7vx2k-glibc-2.40-36/lib/glibc-hwcaps/x86-64-v3/libc.so.6", O_RDONLY|O_CLOEXEC) = -1 ENOENT (No such file or directory)
newfstatat(AT_FDCWD, "/nix/store/nqb2ns2d1lahnd5ncwmn6k84qfd7vx2k-glibc-2.40-36/lib/glibc-hwcaps/x86-64-v3/", 0x7ffc1f6fbf30, 0) = -1 ENOENT (No such file or directory)
openat(AT_FDCWD, "/nix/store/nqb2ns2d1lahnd5ncwmn6k84qfd7vx2k-glibc-2.40-36/lib/glibc-hwcaps/x86-64-v2/libc.so.6", O_RDONLY|O_CLOEXEC) = -1 ENOENT (No such file or directory)
newfstatat(AT_FDCWD, "/nix/store/nqb2ns2d1lahnd5ncwmn6k84qfd7vx2k-glibc-2.40-36/lib/glibc-hwcaps/x86-64-v2/", 0x7ffc1f6fbf30, 0) = -1 ENOENT (No such file or directory)
openat(AT_FDCWD, "/nix/store/nqb2ns2d1lahnd5ncwmn6k84qfd7vx2k-glibc-2.40-36/lib/libc.so.6", O_RDONLY|O_CLOEXEC) = 4
read(4, "\177ELF\2\1\1\3\0\0\0\0\0\0\0\0\3\0>\0\1\0\0\0@\244\2\0\0\0\0\0"..., 832) = 832
pread64(4, "\6\0\0\0\4\0\0\0@\0\0\0\0\0\0\0@\0\0\0\0\0\0\0@\0\0\0\0\0\0\0"..., 784, 64) = 784
fstat(4, {st_mode=S_IFREG|0555, st_size=2335712, ...}) = 0
pread64(4, "\6\0\0\0\4\0\0\0@\0\0\0\0\0\0\0@\0\0\0\0\0\0\0@\0\0\0\0\0\0\0"..., 784, 64) = 784
mmap(NULL, 2067928, PROT_READ, MAP_PRIVATE|MAP_DENYWRITE, 4, 0) = 0x7f5e5727a000
mmap(0x7f5e572a2000, 1474560, PROT_READ|PROT_EXEC, MAP_PRIVATE|MAP_FIXED|MAP_DENYWRITE, 4, 0x28000) = 0x7f5e572a2000
mmap(0x7f5e5740a000, 352256, PROT_READ, MAP_PRIVATE|MAP_FIXED|MAP_DENYWRITE, 4, 0x190000) = 0x7f5e5740a000
mmap(0x7f5e57460000, 24576, PROT_READ|PROT_WRITE, MAP_PRIVATE|MAP_FIXED|MAP_DENYWRITE, 4, 0x1e5000) = 0x7f5e57460000
mmap(0x7f5e57466000, 52696, PROT_READ|PROT_WRITE, MAP_PRIVATE|MAP_FIXED|MAP_ANONYMOUS, -1, 0) = 0x7f5e57466000
close(4)                                = 0
mmap(NULL, 12288, PROT_READ|PROT_WRITE, MAP_PRIVATE|MAP_ANONYMOUS, -1, 0) = 0x7f5e57277000
arch_prctl(ARCH_SET_FS, 0x7f5e57277740) = 0
set_tid_address(0x7f5e57277a10)         = 467906
set_robust_list(0x7f5e57277a20, 24)     = 0
rseq(0x7f5e57278060, 0x20, 0, 0x53053053) = 0
mprotect(0x7f5e57460000, 16384, PROT_READ) = 0
mprotect(0x403000, 4096, PROT_READ)     = 0
mprotect(0x7f5e574aa000, 8192, PROT_READ) = 0
prlimit64(0, RLIMIT_STACK, NULL, {rlim_cur=16384*1024, rlim_max=RLIM64_INFINITY}) = 0
fstat(1, {st_mode=S_IFCHR|0620, st_rdev=makedev(0x88, 0x2), ...}) = 0
getrandom("\xc3\xaa\x18\x11\xb5\x45\x97\x82", 8, GRND_NONBLOCK) = 8
brk(NULL)                               = 0x33d6f000
brk(0x33d90000)                         = 0x33d90000
write(1, "hello world!\n", 13)          = 13
exit_group(13)                          = ?
+++ exited with 13 +++
Oh my. Have we even gotten closer to the solution? Of the following output, the only recognizable line is write(1, "hello world!\n", 13) = 13, which tells us that printing is using a write syscall to send the output. The output has a lot of information we do not understand yet, and I do not know what data we want to look for. On the positive side, at least the output fits on a screen now. Tracing the output hasn’t gotten us anywhere and these syscalls still look daunting.
We need to break out our debugging hats ![]() . If we have faith that we will be able to solve this problem, then we will be able to figure out what is going on. Let us try repeating the strategy of looking at the output of our tools. This time
. If we have faith that we will be able to solve this problem, then we will be able to figure out what is going on. Let us try repeating the strategy of looking at the output of our tools. This time gcc and the standard output on the command line haven’t suggested anything to us.
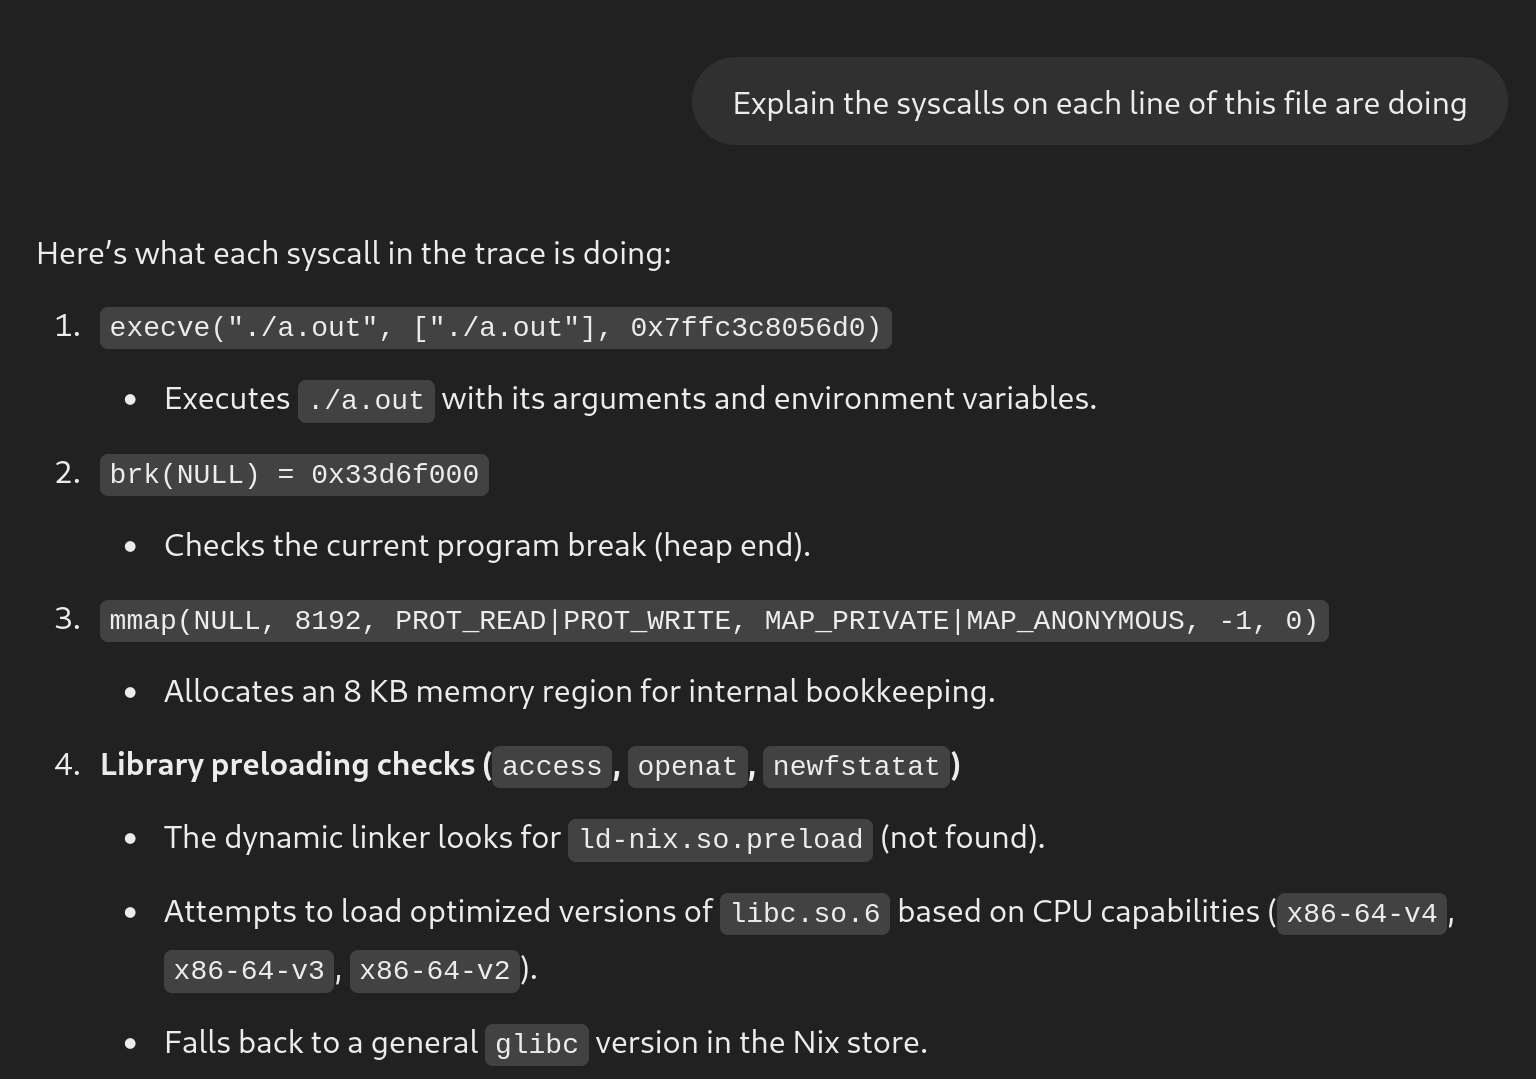
This will be quite tedious. Can we offload the busy work an LLM and see what it says? We live in the 21st century, so although I wouldn’t trust an LLM to give the correct answer, it can helpfully suggest terms to look up.
Instructor: You are going down the wrong track. Let’s back up.
We need to take a moment to think about this approach. strace is too hard to interpret because it requires us to first understand what all these syscalls are.
Debugging Process:
↛ Load and trace a “simple” program ⟶ ❌
↛ Load a minimal program
⇝ Idea:
printfis a function call↛ check compiler output ⟶ ❌
↛ check
straceoutput ⟶ use LLM ⟶ ❌⇝ dead end…?
Maybe we should take a look at a different level of abstraction? There is nothing more we can learn from the source C file. It seems like we need to go deeper. Is there another file we have?
Binary spelunking
What is inside this a.out thing? I know it is a compiled binary, so this must contain all the machine code instructions that are running, right?
$ vim a.out
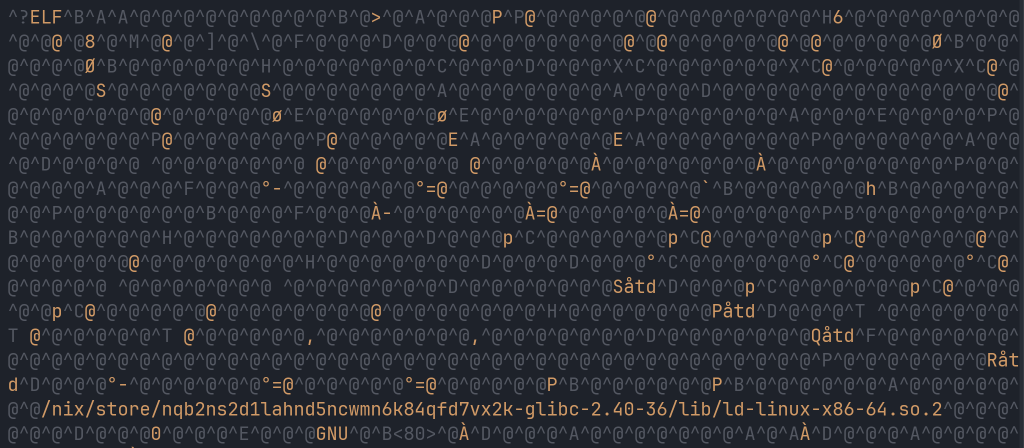
Uh, that’s not right. I don’t think there is anything useful here to see. I do see some characters rendering correctly, but they look like nonsense. I see “ELF” and then some file paths at the start and end of this file.
Let’s put a pin in this stuff we have seen in case it comes up later. Writing a log of what you have tried while debugging is essential to be able to keep all the relevant context in your head. What works, as well as what didn’t, helps narrow the scope of debugging.
So far, strace did not help. We have some hints on how to proceed. We can either look at the filepaths in the binary file, or we can look further into what gcc was telling us about the implicit definition of printf.
How to open a binary?
: Dear search engine, how can I open
a.outC binary file?
The the tool we need is objdump. objdump comes installed with the gcc package. This bundling indicates that objdump is a default tool important to be familiar with.
But first, I want to slightly modify the program we are looking at. Our hello_world.c is deterministic*, which means it does the same thing every time. Instead, let’s make something more realistic, such as a program that asks for the user’s name and responds.
“Hello {name}”
> void main(int argc, char** argv) {
>   if (argc < 2) {
>     printf("hello: error with argc\n");
>     return -1;
>   }
<   printf("hello world!\n");
>   printf("hello, %s!\n", argv[1]);
  return 0;
  }
Now we print out a name given to us from the command line, as so ./a.out Samir. Take a moment to think about whether you understand the change I made.
Can you explain what argc is and why I check if it is 2? Why not 1? Why do I index 1 into argv if C arrays are zero indexed?
Practice looking this question up. Stack overflow is a wonderful library of questions. Try searching “what is argc and argv in C”.
Back to the objdump
$ objdump # first look at the help output
<omitted>
$ objdump -D ./a.out
<abbreviated for readability>
0000000000401050 <main>:
  401050:       48 83 ec 08             sub    $0x8,%rsp
  401054:       83 ff 01                cmp    $0x1,%edi
  401057:       7e 1e                   jle    401077 <main+0x27>
  401059:       48 8b 56 08             mov    0x8(%rsi),%rdx
  40105d:       bf 02 00 00 00          mov    $0x2,%edi
  401062:       31 c0                   xor    %eax,%eax
  401064:       48 8d 35 b0 0f 00 00    lea    0xfb0(%rip),%rsi        # 40201b <_IO_stdin_used+0x1b>
  40106b:       e8 d0 ff ff ff          call   401040 <__printf_chk@plt>
  401070:       31 c0                   xor    %eax,%eax
  401072:       48 83 c4 08             add    $0x8,%rsp
  401076:       c3                      ret
  401077:       48 8d 3d 86 0f 00 00    lea    0xf86(%rip),%rdi        # 402004 <_IO_stdin_used+0x4>
  40107e:       e8 ad ff ff ff          call   401030 <puts@plt>
  401083:       83 c8 ff                or     $0xffffffff,%eax
  401086:       eb ea                   jmp    401072 <main+0x22>
  401088:       0f 1f 84 00 00 00 00    nopl   0x0(%rax,%rax,1)
  40108f:       00
I see some nonsense in the objdump. I cannot recognize this binary is the same as my original hello_name.c.
One tip is to try doing the simplest possible test when trying a new strategy. Minimizing the experiment ensures we do not get overloaded with unnecessary context.
First, we must recompile with debug flags to make this easier. I think we have explored our way to the right level of abstraction on what printf is actually doing. Binary spelunking is the perfect way to see what the CPU runs to make “hello world” show up.
$ gcc -g hello_world.c
$ objdump -D ./a.out
We must be persistent. Making new systems wouldn’t be fun if it was easy. By the end, I promise your appreciation for the immense scope of real systems will grow.
There are many flags to objdump, which you can find on the man page. We might need to try some random flags before finding something useful. Again, the goal is to both induct new hypotheses on what is happening and deduct possibilities that are definitely not valid explanations for the behavior we are seeing 2.

Debugging tools let us slice the problem space into smaller pieces until we’ve dissected every behavior in the system.
$ objdump -p ./a.out
<omitted>
$ objdump -h ./a.out
<omitted>
Ooh, I like the output of -h. It’s concise and readable. We are getting somewhere, so I want to be more thoughtful about what step we take next. Trying a few more commands…
$ objdump -t ./a.out
<omitted>
$ objdump -d ./a.out
<omitted>
$ objdump -D ./a.out
a.out:     file format elf64-x86-64

Disassembly of section .interp:
0000000000400318 <.interp>:
---------- snipped for clarity ----------
… this also looks helpful. Let’s recap. What can we check out next? There was the thing called “ELF”. I dismissed it before when looking at the binary, but it keeps coming up. I also want to look deeper into the disassembly.
A spoiler: we are going to need to understand both of these things, so the order doesn’t matter.
dumpster fire
There’s a lot of output from this disassembly, 1257 lines. Scrolling through the assembly, it does not seem productive to jump into tracing the entire program; we need to start with something smaller.
where art thou, printf?
Find printf with grep.
$ objdump -D ./a.out | grep "printf"
<output is empty...>
We turned on debug symbols, what gives?
: wtf?
: You know, I have a great idea how to finish debugging this. Let’s give up.
The challenge is what makes debugging fun! Anticipate how much satisfaction you’ll feel when we figure this out together! Is there something simple we missed, similar to how we skipped over the seemingly irrelevant references to “ELF”?
Another low hanging fruit to investigate is the objdump section titles. Analyzing the sections will give us a foothold on the huge assembly output.
$ objdump -D ./a.out | grep "section"
Disassembly of section .interp:
Disassembly of section .note.gnu.property:
Disassembly of section .note.ABI-tag:
Disassembly of section .hash:
Disassembly of section .gnu.hash:
Disassembly of section .dynsym:
Disassembly of section .dynstr:
Disassembly of section .gnu.version:
Disassembly of section .gnu.version_r:
Disassembly of section .rela.dyn:
Disassembly of section .rela.plt:
Disassembly of section .init:
Disassembly of section .plt:
Disassembly of section .text:
<snipped>
Nevermind, these sections are more information that we do not know what to do with. Since we’re stuck, we need to backtrack and try another path forward. Instead of using my contrived program, let’s go back to a simple real program like nautilus.
objdump -D $(which nautilus) | grep "printf"
0000000000401080 <__asprintf_chk@plt>:
  401080:       ff 25 4a 3f 00 00       jmp    *0x3f4a(%rip)        # 404fd0 <__asprintf_chk@GLIBC_2.8>
  40132f:       e8 4c fd ff ff          call   401080 <__asprintf_chk@plt>
What? I was not expecting this at all. I was staring at this wall we got stuck at and thought I would have to try a bunch of things to get through. But this is something we didn’t expect. Why did changing the binary we use make a difference?
We have found something that doesn’t fit in our mental model. Great! Now we get an opportunity to learn something cool and update our knowledge.
Does this weird thing also happen for hello_name.c? Indeed, we see printf.
$ objdump -D ./a.out | grep "printf"
0000000000401040 <__printf_chk@plt>:
  401040:       ff 25 a2 2f 00 00       jmp    *0x2fa2(%rip)        # 403fe8 <__printf_chk@GLIBC_2.3.4>
  401067:       e9 d4 ff ff ff          jmp    401040 <__printf_chk@plt>
Comparing the objdump of hello_name and hello_world reveals two different kinds of library calls.
  40106b:       e8 d0 ff ff ff          call   401040 <__printf_chk@plt>

  40107e:       e8 ad ff ff ff          call   401030 <puts@plt>
The hello_world binary doesn’t have any printf, but hello_name has both. What is the difference between puts and printf? The binary appears to call one reference to puts@plt and one to __printf_chk@plt. puts is simpler than printf because it does not do string formatting (ex: %d). If you are printing a fixed literal string, then the compiler will probably make a call to the more efficient puts function instead.
We can get back to debugging the main issue of what printf is doing. The code is a few lines, so we can check this manually. Let us go into the objdump where this is found, no expert tooling needed:
$ objdump -D ./a.out | less
# then type "/printf" <enter>
Disassembly of section .plt:

0000000000401020 <puts@plt-0x10>:
  401020:       ff 35 aa 2f 00 00       push   0x2faa(%rip)        # 403fd0 <_GLOBAL_OFFSET_TABLE_+0x8>
  401026:       ff 25 ac 2f 00 00       jmp    *0x2fac(%rip)        # 403fd8 <_GLOBAL_OFFSET_TABLE_+0x10>
  40102c:       0f 1f 40 00             nopl   0x0(%rax)

0000000000401030 <puts@plt>:
  401030:       ff 25 aa 2f 00 00       jmp    *0x2faa(%rip)        # 403fe0 <puts@GLIBC_2.2.5>
  401036:       68 00 00 00 00          push   $0x0
  40103b:       e9 e0 ff ff ff          jmp    401020 <_init+0x20>

0000000000401040 <__printf_chk@plt>:
  401040:       ff 25 a2 2f 00 00       jmp    *0x2fa2(%rip)        # 403fe8 <__printf_chk@GLIBC_2.3.4>
  401046:       68 01 00 00 00          push   $0x1
  40104b:       e9 d0 ff ff ff          jmp    401020 <_init+0x20>

Disassembly of section .text:

0000000000401050 <main>:
  401050:       83 ff 01                cmp    $0x1,%edi
  401053:       7e 17                   jle    40106c <main+0x1c>
  401055:       48 8b 56 08             mov    0x8(%rsi),%rdx
  401059:       bf 02 00 00 00          mov    $0x2,%edi
  40105e:       31 c0                   xor    %eax,%eax
  401060:       48 8d 35 b4 0f 00 00    lea    0xfb4(%rip),%rsi        # 40201b <_IO_stdin_used+0x1b>
  401067:       e9 d4 ff ff ff          jmp    401040 <__printf_chk@plt>
Disassembly of section .plt:
[...]
0000000000401040 <__printf_chk@plt>:
  401040:       ff 25 a2 2f 00 00       jmp    *0x2fa2(%rip)        # 403fe8 <__printf_chk@GLIBC_2.3.4>
  401046:       68 01 00 00 00          push   $0x1
  40104b:       e9 d0 ff ff ff          jmp    401020 <_init+0x20>

Disassembly of section .text:
[...]
0000000000401050 <main>:
  [...]
  401067:       e9 d4 ff ff ff          jmp    401040 <__printf_chk@plt>
Pretty Little Thing
We see all these references to plt. The Internet informs us that the PLT is some sort of table with pointers to the real locations of functions.
Why would we not know where printf is? We must remember this function is from libc. In fact, the dump notes printf is defined from GLIBC version 2.3.4.
We have debunked the theory that printf is a normal function call. Then what is it? You will be unable to find a definition of printf in the binary, regardless of how hard you look.
: how can I be sure
printfis actually a part of libc? You’re some rando on the internet, not my teacher.Instructor: Spoken like a true skeptic.
main()and then start executing instructions. My entire binary has been printed, so something is definitely wrong withobjdump.
Alas, another twist in the road. First one nitpick–main() is not the first thing that runs. The dump has a _start symbol which is the entrypoint that libc uses to call main3. Yes, it is the case that we have the whole binary. Think back to when we opened a.out in vim. Did we see something in addition to some uninterpretable binary? Hint: at the start and end of the file.
Return of the Elves
Yes! There are ELF headers. The Internet reveals that ELF is a file format. The readelf tool is used to inspect ELF headers. Let’s look at this data for hints about our elusive printf.
The man page suggests to use -a to print all headers. We can use our newfound knowledge of PLTs to grep for plt. This leads us to the “Relocation section” of the readelf output. For readability, we can print this one section and inspect it.
$ readelf -r ./a.out
Relocation section '.rela.dyn' at offset 0x5f0 contains 2 entries:
  Offset          Info           Type           Sym. Value    Sym. Name + Addend
000000403ff0  000100000006 R_X86_64_GLOB_DAT 0000000000000000 __libc_start_main@GLIBC_2.34 + 0
000000403ff8  000300000006 R_X86_64_GLOB_DAT 0000000000000000 __gmon_start__ + 0

Relocation section '.rela.plt' at offset 0x620 contains 2 entries:
  Offset          Info           Type           Sym. Value    Sym. Name + Addend
000000403fe0  000200000007 R_X86_64_JUMP_SLO 0000000000000000 puts@GLIBC_2.2.5 + 0
000000403fe8  000400000007 R_X86_64_JUMP_SLO 0000000000000000 __printf_chk@GLIBC_2.3.4 + 0
Lucky! printf has conveniently appeared here. Indeed, these addresses match up with the offsets we saw in the binary. A call to printf will dereference the value at the offset and use that implementation # 403fe8 <__printf_chk@GLIBC_2.3.4>.
We can see that the compiler has told us in the “Sym[bol] Value” column that printf is located at 0x0. But wait, isn’t that a suspicious address? 0x0 is a NULL pointer.
We have all the information we need. Let’s continue backtracking and synthesizing this new intel we gathered. Let’s go back to strace. This will capture everything happening at runtime and the order in which it happens.
Ignoring the noisy failures of looking for libc, the program takes a few steps.
openat(AT_FDCWD, "/nix/store/nqb2ns2d1lahnd5ncwmn6k84qfd7vx2k-glibc-2.40-36/lib/libc.so.6", O_RDONLY|O_CLOEXEC) = 4
read(4, "\177ELF\2\1\1\3\0\0\0\0\0\0\0\0\3\0>\0\1\0\0\0@\244\2\0\0\0\0\0"..., 832) = 832
pread64(4, "\6\0\0\0\4\0\0\0@\0\0\0\0\0\0\0@\0\0\0\0\0\0\0@\0\0\0\0\0\0\0"..., 784, 64) = 784
fstat(4, {st_mode=S_IFREG|0555, st_size=2335712, ...}) = 0
pread64(4, "\6\0\0\0\4\0\0\0@\0\0\0\0\0\0\0@\0\0\0\0\0\0\0@\0\0\0\0\0\0\0"..., 784, 64) = 784
mmap(NULL, 2067928, PROT_READ, MAP_PRIVATE|MAP_DENYWRITE, 4, 0) = 0x7f5c576cd000
mmap(0x7f5c576f5000, 1474560, PROT_READ|PROT_EXEC, MAP_PRIVATE|MAP_FIXED|MAP_DENYWRITE, 4, 0x28000) = 0x7f5c576f5000
mmap(0x7f5c5785d000, 352256, PROT_READ, MAP_PRIVATE|MAP_FIXED|MAP_DENYWRITE, 4, 0x190000) = 0x7f5c5785d000
mmap(0x7f5c578b3000, 24576, PROT_READ|PROT_WRITE, MAP_PRIVATE|MAP_FIXED|MAP_DENYWRITE, 4, 0x1e5000) = 0x7f5c578b3000
mmap(0x7f5c578b9000, 52696, PROT_READ|PROT_WRITE, MAP_PRIVATE|MAP_FIXED|MAP_ANONYMOUS, -1, 0) = 0x7f5c578b9000
close(4)                                = 0
If you roll up your sleeves and do some good, old-fashioned documentation sleuthing, you can understand what this previously overwhelming strace output means. We also know that our LLM above was speaking confidently about things it doesn’t know. Although it looked believable, it got many facts completely wrong. Instead of LLMs, let’s apply our willpower to see what these straced lines mean. man 2 has all the info we need. You can see more detail in now it’s your turn.
-
openat(libc.so.6): open thelibcexecutable file on disk -
read: readlibc.so.6from disk into memory -
pread64: continue reading from where it left off -
mmap: map the library into the process address space as readable and executable, but not writable. Allocates some writable memory. -
close: close the file descriptor of the library
Student: I’m still not satisfied. We never saw any reference to any logic of looking for
libcin ourobjdump.Instructor: That’s the spirit. Do you have any ideas?
Student: The first thing that pops into my mind is let’s open this file
.../libc.so.6invimInstructor: Good idea. I can’t discern anything from this file, but I do see this “ELF” mention again. What do we do when we see this?
Student:
readelf!
$ readelf -a ...path/to/libc.so.6
There is a lot of output, but we can take a few seconds to skim the output. I piped this multi-thousand line output into less and held the spacebar to skim if anything catches my eye. I see a huge section “Symbol table ‘.dynsym’ contains 3158 entries” which has a lot of “FUNC” entries. This table appears to contain a reference to every function in libc. But why are these all in the dynamic symbol section? It appears this file doesn’t know where these functions are located. The rabbit hole goes deeper; let’s not lose hope.
Go Deeper, Buddy
We first need to search up some background information to understand what is going on. The Procedure Linkage Table (PLT) contains stub code which looks up the location of a function in the Global Offset Table (GOT) and jumps there. The GOT is an array of pointers which holds the actual addresses of these functions.
Instructor: That’s great you know that. But what is it actually doing?
We can use gdb to gain confidence in (or to invalidate) our new theory. We know the address of our plt, so let’s print out that memory and confirm it gets loaded even before our code runs.
Tracing PLT and GOT
#include <stdio.h>

int main() {
        printf("hello world!\n");
        printf("hello world!\n");
        return 0;
}
$ gcc -fno-pie -no-pie -g explore_plt.c
$ gdb a.out
(gdb) b explore_plt.c:4
Breakpoint 1 at 0x401040: file explore_plt.c, line 4.
(gdb) b explore_plt.c:5
Breakpoint 2 at 0x40104e: file explore_plt.c, line 5.
(gdb) r
(gdb) disass main
Dump of assembler code for function main:
   0x0000000000401050 <+0>:     sub    $0x8,%rsp
   0x0000000000401054 <+4>:     mov    $0x402000,%edi
   0x0000000000401059 <+9>:     call   0x401020 <puts@plt>
   0x000000000040105e <+14>:    mov    $0x402000,%edi
   0x0000000000401063 <+19>:    add    $0x8,%rsp
   0x0000000000401067 <+23>:    jmp    0x401020 <puts@plt>
End of assembler dump.
(gdb) disass 'puts@plt'
Dump of assembler code for function puts@plt:
   0x0000000000401030 <+0>:     jmp    *0x2fb2(%rip)        # 0x403fe8 <puts@got.plt>
   0x0000000000401036 <+6>:     push   $0x0
   0x000000000040103b <+11>:    jmp    0x401020
End of assembler dump.
(gdb) p/x *(void**)0x403fe8
$1 = ...
# Exercise: What does this line print at different points in the function?
The jmp instruction in the plt is a jump which follows a pointer to the jump location. gdb left a comment telling us that this value points to the entry for the “puts” symbol in the GOT. Cool! We can confirm this pointer lives in the area of virtual memory which strace told us that libc got read to. This discovery confirms printf is not a function call inside our code. Your OS’s libc provides the implementation.
If we look back at the strace and search for this address 0x403fe8, we will see this line get matched.
mprotect(0x403000, 4096, PROT_READ) = 0
This line makes the table entries read only. The pwning blog post in further reading explains more. In context of our program, this means that the entire GOT got resolved and then marked as read only for security4.
Exercise: What does print statement at the end of the above `gdb` code block print at different breakpoints in the function? Why?
You should notice that the value stored at the pointer changes before and after the first
printfcall. Most programs do not use every function of every dynamically linked library, so it can be more efficient to only load entries which are used. Initially, GOT entries initially point to a stub in the PLT that will invoke the dynamic linker for resolution. The code for this initialization is already in the process’ address space, so the PLT can directly call it to load the needed entry on-demand.
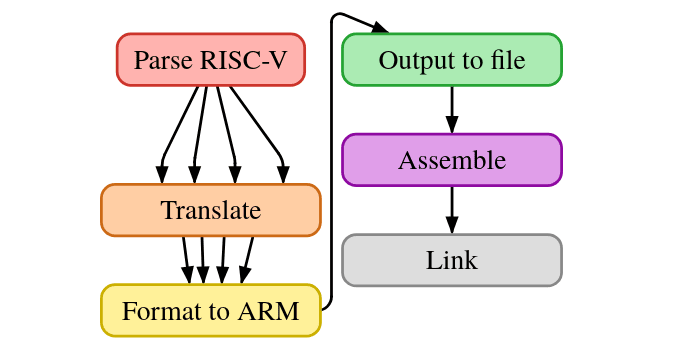
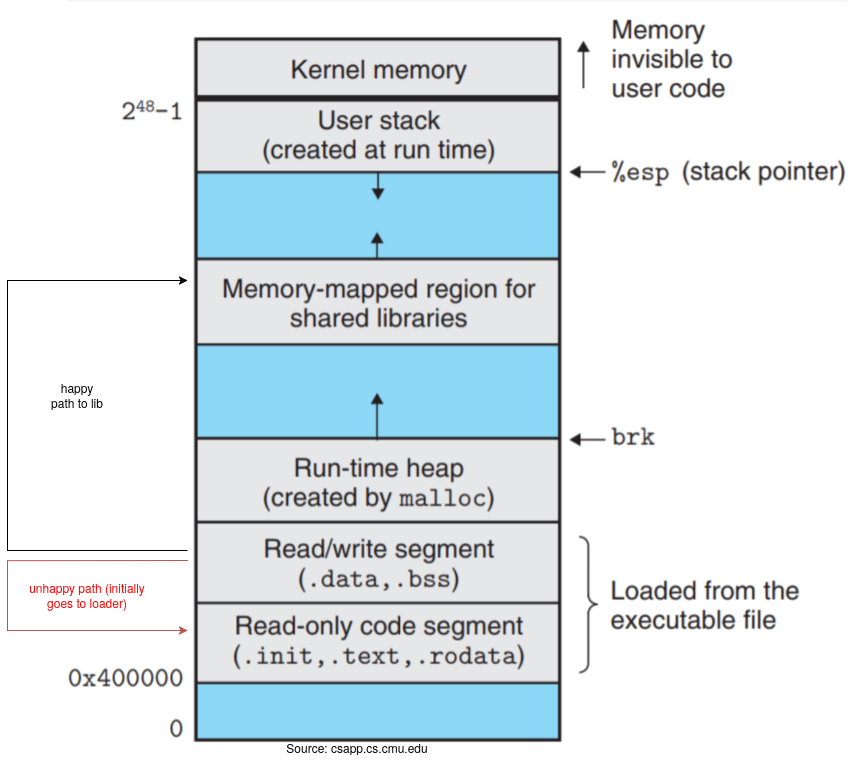
The execution flows from the assembly which points to the PLT that contains a shim to do a GOT lookup. The happy path leads directly to the library code. On the first use of a library function, the execution falls through using the red path, which asks some code to locate the library function.
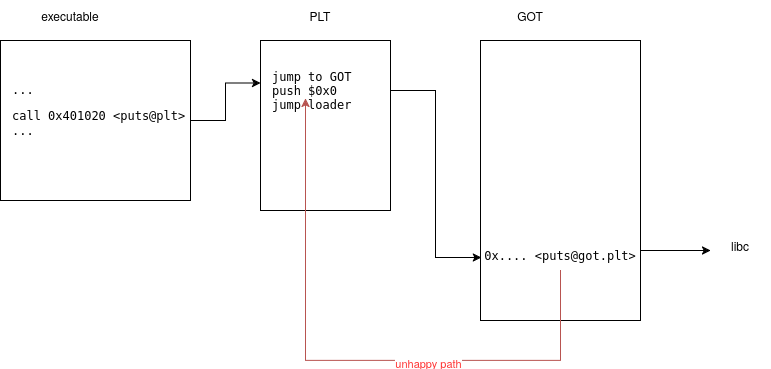
In the process’ memory layout, the GOT entries initially point to loader executable code, then to the location of the instructions inside the library.
Knowledge Check
Armed with this knowledge, we can both understand the world and bend it to our will. Let’s use gdb to change where the function points. If I write a second function and recompile, I can modify execution from printf to my own function! (Left as an exercise for you in this section.) How does it feel to be able to fully understand the system and control its behavior?
With what you know, you should be able to complete this fun and difficult exercise using normal control flow. Can you find an input to this function which causes the
printfline to run?#include <stdlib.h> #include <unistd.h> #include <stdio.h> #include <string.h> int target; void hello() { printf("code execution redirected! you win\n"); _exit(1); } void vuln() { char buffer[512]; fgets(buffer, sizeof(buffer), stdin); printf(buffer); exit(1); } int main(int argc, char **argv) { vuln(); }Source: protostar, updated version
Background knowledge: LiveOverflow video
Solution: LiveOverflow video
Even if you do not go through the exercise, this video is well worth watching. It is far easier to understand the execution flow through the GOT and PLT in video form.
We learned how Linux loads processes and dynamically loads libraries. We even know how to manipulate a running program. The “GOT and PLT for pwning” in further reading explains how to pwn the PLT/GOT.
Now it’s your turn
We have covered everything now. Can you explain it? Do it, I’m serious. I’m listening from the other side of your screen. Draw out all the steps.
To make sure we haven’t missed anything, we can map these steps to the each syscall strace lists when running a program.
- Pressing enter with
./a.outin bash -
bashwill fork and then execve./a.out - Linux reads the ELF and loads the headers
- ld-loader
- libc start
- run app
- printf
- exit
For a detailed explanation of every line, expand this dropdown:
Detailed syscall explanation (expand)
syscall tracing a dynamic-linked 'Hello World' program with 1 format argument
maizure.org

$strace ./printf1
1  - execve("./printf1", ["./printf1"], [/* 47 vars */]) = 0
2  - brk(NULL)                               = 0x1dde000
3  - mmap(NULL, 4096, PROT_READ|PROT_WRITE, MAP_PRIVATE|MAP_ANONYMOUS, -1, 0) = 0x7f59bce82000
4  - access("/etc/ld.so.preload", R_OK)      = -1 ENOENT (No such file or directory)
5  - open("/etc/ld.so.cache", O_RDONLY|O_CLOEXEC) = 3
6  - fstat(3, {st_mode=S_IFREG|0644, st_size=83694, ...}) = 0
7  - mmap(NULL, 83694, PROT_READ, MAP_PRIVATE, 3, 0) = 0x7f59bce6d000
8  - close(3)                                = 0
9  - open("/lib64/libc.so.6", O_RDONLY|O_CLOEXEC) = 3
10 - read(3, "\177ELF\2\1\1\3\0\0\0\0\0\0\0\0\3\0>\0\1\0\0\0\20\35\2\0\0\0\0\0"..., 832) = 832
11 - fstat(3, {st_mode=S_IFREG|0755, st_size=2127336, ...}) = 0
12 - mmap(NULL, 3940800, PROT_READ|PROT_EXEC, MAP_PRIVATE|MAP_DENYWRITE, 3, 0) = 0x7f59bc89f000
13 - mprotect(0x7f59bca57000, 2097152, PROT_NONE) = 0
14 - mmap(0x7f59bcc57000, 24576, PROT_READ|PROT_WRITE, MAP_PRIVATE|MAP_FIXED|MAP_DENYWRITE, 3, 0x1b8000) = 0x7f59bcc57000
15 - mmap(0x7f59bcc5d000, 16832, PROT_READ|PROT_WRITE, MAP_PRIVATE|MAP_FIXED|MAP_ANONYMOUS, -1, 0) = 0x7f59bcc5d000
16 - close(3)                                = 0
17 - mmap(NULL, 4096, PROT_READ|PROT_WRITE, MAP_PRIVATE|MAP_ANONYMOUS, -1, 0) = 0x7f59bce6c000
18 - mmap(NULL, 8192, PROT_READ|PROT_WRITE, MAP_PRIVATE|MAP_ANONYMOUS, -1, 0) = 0x7f59bce6a000
19 - arch_prctl(ARCH_SET_FS, 0x7f59bce6a740) = 0
20 - mprotect(0x7f59bcc57000, 16384, PROT_READ) = 0
21 - mprotect(0x600000, 4096, PROT_READ)     = 0
22 - mprotect(0x7f59bce83000, 4096, PROT_READ) = 0
23 - munmap(0x7f59bce6d000, 83694)           = 0
24 - fstat(1, {st_mode=S_IFCHR|0620, st_rdev=makedev(136, 0), ...}) = 0
25 - mmap(NULL, 4096, PROT_READ|PROT_WRITE, MAP_PRIVATE|MAP_ANONYMOUS, -1, 0) = 0x7f59bce81000
26 - write(1, "Hello World 1\n", 14Hello World 1)         = 14
27 - exit_group(0) = ?
+++ exited with 0 +++

Line 1  - Program is forked from bash and calls execve() to load ./printf1 with the default argument of program name.
Line 2  - Program calls brk() to find the current end of the data segment, which is 0x1dde000. If this program wanted
          space on the heap, there would be subsequent calls to brk() using higher values. That's not the case this time.
Line 3  - Memory maps a page of read-write memory that is not backed by a file (all 0s) and not sharable. At 0x7f59bce82000
Line 4  - Checks permissions of user-specified shared libraries. There are none, so this access attempt fails.
Line 5  - Opens the file containing the list of directors to search for shared libraries. Returned as file descriptor 3.
Line 6  - Checks the status of the new file descriptor. File is 21 pages of memory size (83694 bytes, 4096 bytes per page).
Line 7  - Memory maps the directory list as private and read-only. It now lives between 0x7f59bce6d000 - 0x7f59bce81000.
Line 8  - Closes the shared-library directory list, file descriptor 3 is available again
Line 9  - Opens the symbolic link to the shared standard library (libc.so.6) as file descriptor 3.
Line 10 - Reads the first 832 bytes of the library, header + extras for 64-bit. Success, with 832 bytes read.
Line 11 - Gets the file data for the shared library. Size is 2127336 (520 pages of memory)
Line 12 - Memory map the standard library as read-able and executable, but not writable. It will live at 0x7f59bc89f000.
Line 13 - Removes all access to ~2MB of memory after libc code (likely guard pages)
Line 14 - Memory maps 6 more pages from libc (pages 440-445) as read-write. Scratch space?
Line 15 - Maps four more pages of generic read-write memory between 0x7f59bcc5d000 and 0x7f59bcc62000
Line 16 - Closes the shared standard library file. File descriptor 3 is now available again.
Line 17 - Memory maps a page of read-write memory, probably to suppose thread usage.
Line 18 - Memory maps another 2 pages of memory for read and write. This is probably used for thread local storage
Line 19 - Sets FS to the newly reserved thread local storage area
Line 20 - Sets 4 pages of the standard library to read only
Line 21 - Sets the read-only data application segment (subsequent page is .BSS)
Line 22 - Sets a page of the dynamic linker library to read-only
Line 23 - Unmaps the shared library directory memory space, since the library has been loaded
Line 24 - Gets the status of the stdout file descriptor (/dev/pts/0)
Line 25 - Memory maps a page used in printf's temporary buffer for format resolution
Line 26 - Printf's write syscall for Hello World 1
Line 27 - Exit with status 0
Source: maizure
We can be confident that these are the steps that get taken. We found a path that definitely explains the chain of events. However, the question remains: who is doing all this work? Nothing happens by magic. There is code somewhere that is populating our PLT table, and it sure is not in a.out. Or is it?
There are two cases. Either this logic is in a.out or it is done by the kernel during the execve syscall to set up the process. It’s easy to blame behavior we don’t understand on things we don’t understand. In either case, we should be able to trace what is going on. What if I told you dynamic loading does not use any special kernel features? We saw every syscall that gets called. If strace is observing a syscall happening, then it must be getting triggered by something in userspace. All the syscalls we see getting called are completely general. I don’t see syscalls called anything like “dynamic load” to suggest a special mechanism is happening. Unix is all about simplicity. Given this hint, let’s take it from the top and trace to see where the code is coming from.
Look at the bytes of a.out in vim again. I can see there is a bunch of text at the start and end of the binary. There is compile-time info at the end. This suggests that the text at the end is debug info and the text at the start is the ELF header.
If we carefully scan the binary and readelf this time, there is this file path in both places, which we have been skipping.
[Requesting program interpreter: /nix/store/nqb2ns2d1lahnd5ncwmn6k84qfd7vx2k-glibc-2.40-36/lib/ld-linux-x86-64.so.2]
If you have seen bash or python scripts, this is like the #! shebang placed at the start of a file5. This file path leads to a loader program which does the work of loading our libraries.
: What is the loader doing to reach the start of the program?
The loader copies code and data from an executable file on disk into memory. The loader starts execution of the program at the entrypoint specified in the ELF header. The address of the first instruction is usually the start of
.text, which contains a_startsymbol that runs some CPU specific assembly. This architecture-specific assembly sets up memory and any bookkeeping that need to be done before startingmain()by calling__libc_start_main6.
Isn’t that cool? We loaded libraries with standard kernel mechanisms. The kernel knows how to read ELF headers and called the binary at the provided absolute file path. The kernel does not implement any logic to load libraries.
Now this will blow your mind.
Programs are files. Code is just binary wrapped with some ELF headers sitting on your disk drive. We can see dynamic linking is done using normal file operations. All it takes to dynamically load is to map the library into the memory space at runtime. Using the mmap syscall does just this! Programs can modify their own address space and load libraries however they wish. No special kernel support required! Linux provides us with these general syscall mechanisms which we can flexibly use.
If we zoom out, what was the point of dynamically loading in the first place? We have observed most programs dynamically load libc. But it is all code in the end, why not include it in the same file? Indeed, this would have less runtime overhead since you don’t have to do any loading.
Dynamic linking saves a lot of disk space by deduplicating the code for libc functions like printf. Libraries save disk space and make updating libraries as easy as swapping a single file. Note the size differences between the source code and static vs. dynamically linked binaries.
$ ls -lah hello_world*
-rw-r--r-- 1 user group   64 Apr 11 00:00 hello_world.c
-rwxr-xr-x 1 user group  16K Apr 11 00:00 hello_world.dynamic
-rwxr-xr-x 1 user group  22K Apr 11 00:00 hello_world.static
But, if we load many programs, then we still have the issue that these libc functions are now duplicated in the memory of each program.
Instructor: How would you do that if you were designing it? How would we need to modify library loading to support sharing the same physical memory for every process?
Consider that loading libraries simply puts bytes into memory. All applications run in their own virtual memory spaces. What if we could load libc once and then share this same physical memory.
The diagram7 shows how we could facilitate this sharing. We can keep exactly one copy of a library in physical memory and each process’ virtual addresses map into it.
Let’s dive into what mmap is doing to hypothesize how to add support for sharing physical memory.
: Hoooold on. This doesn’t make any sense. The libraries may need to be loaded into a different place in memory for each process depending on the libraries they specify and the process’ memory layout. It is impossible for a program to be at different points in memory because the addresses in the instructions will be wrong.
Very thoughtful! The libraries are instructions, so any pointers you create will be in a different stack for that process. Pointers should be correct within each individual process. And remember, even if the library is loaded in a different place, our program can locate the libraries by looking up the symbol in the PLT/GOT. This solves the relocation problem from the perspective of our user program. However, the libraries have the challenge that they cannot rely on using fixed addresses in their code because they do not know where they will get loaded in memory. For symbols that call into other libraries it is easy as we can reuse the same idea of symbol to address lookup tables.
Recall in assembly you need to specify a destination address to jump to. Luckily, compiler engineers invented Position Independent Code (PIC/PIE) to support the shared library use case. Using
gccwith-piewill make the compiler emit instructions that only use relative addressing, allowing it to run from any start address. Here is a concrete example exercise that shows the conversion of a normal assembly to position independent.
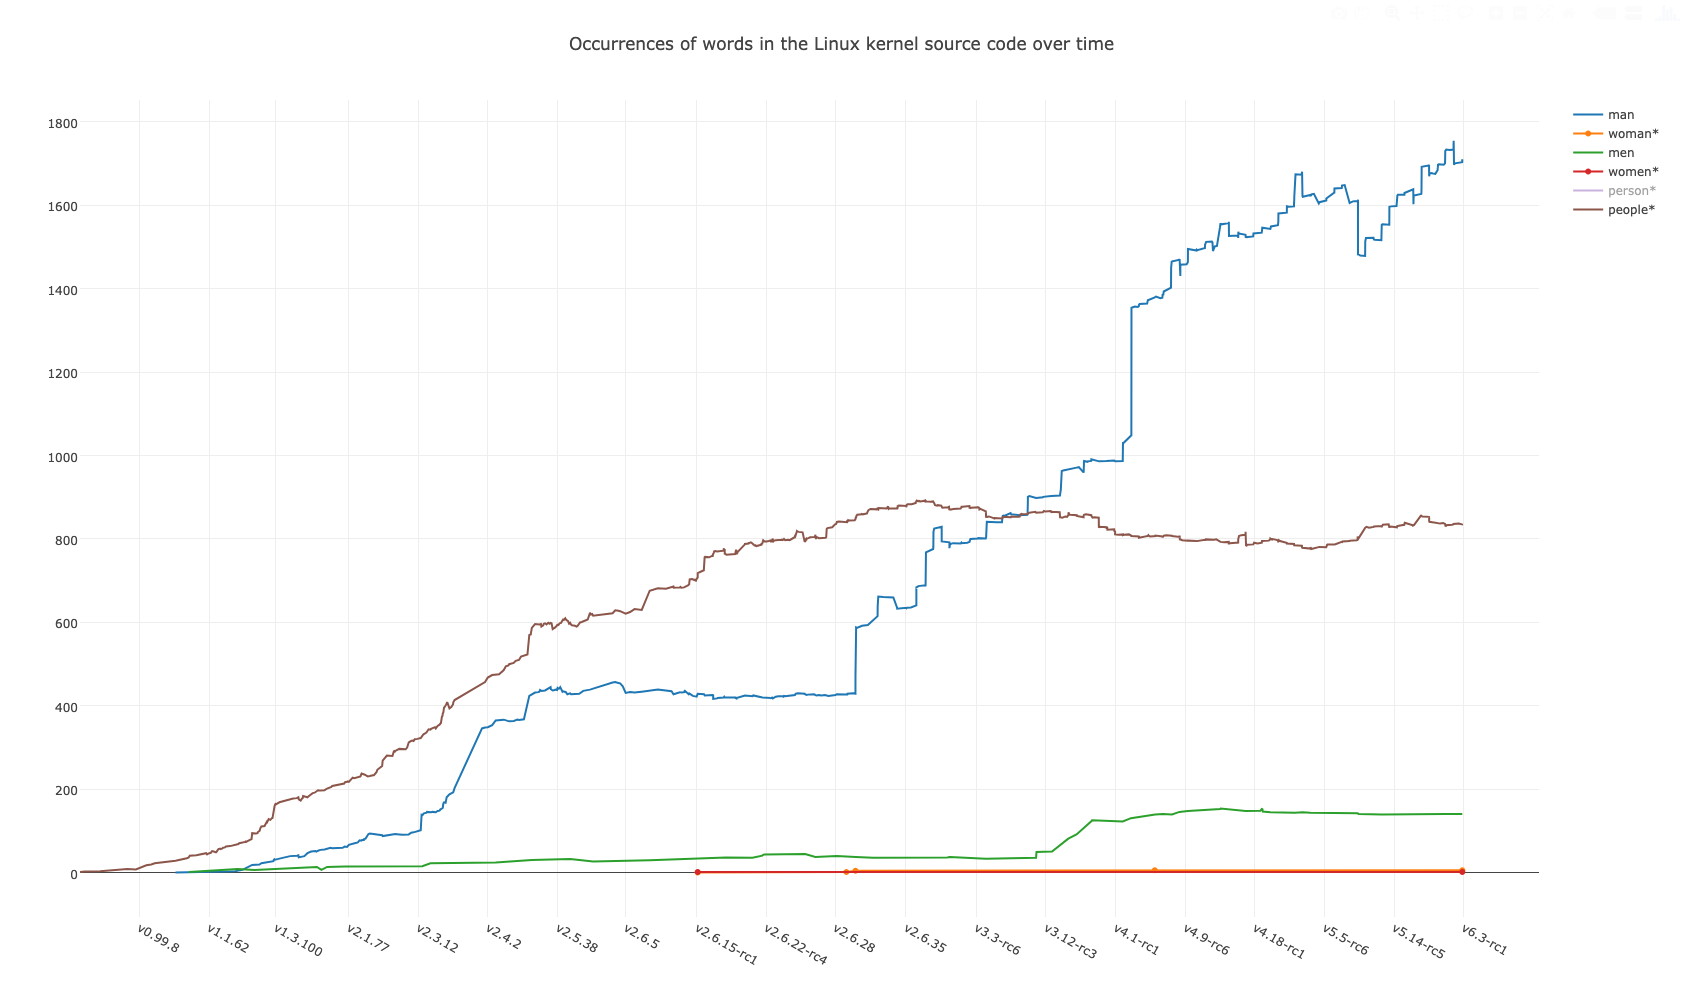
Gimme a man
We need to get a better understanding of what the kernel is doing when we load a library to figure out how many processes changes the way libraries get loaded. We can start by reverse engineering the actions the kernel takes in the strace. Tracing how the library gets loaded by the mmap call should give us some ideas how to support memory sharing.
mmap(NULL, 3940800, PROT_READ|PROT_EXEC, MAP_PRIVATE|MAP_DENYWRITE, 3, 0) = 0x7f59bc89f000
The mmap man documentation explains the behavior of mmap and its flags. man mmap notes to check the other manual, so I check man 2 mmap.
Most of the arguments to mmap are self explanatory from the function prototype: void *mmap(void addr[.length], size_t length, int prot, int flags, int fd, off_t offset);. However, the flag MAP_PRIVATE appears to significant change the way mmap operates.
$ man mmap

MMAP(3P)                                      POSIX Programmer's Manual                                      MMAP(3P)

PROLOG
       This  manual  page  is  part of the POSIX Programmer's Manual.  The Linux implementation of this interface may
       differ (consult the corresponding Linux manual page for details of Linux behavior), or the interface  may  not
       be implemented on Linux.

[...]

       The  parameter  flags provides other information about the handling of the mapped data.  The value of flags is
       the bitwise-inclusive OR of these options, defined in <sys/mman.h>:
                                      ┌───────────────────┬─────────────────────────┐
                                      │ Symbolic Constant │       Description       │
                                      ├───────────────────┼─────────────────────────┤
                                      │ MAP_SHARED        │ Changes are shared.     │
                                      │ MAP_PRIVATE       │ Changes are private.    │
                                      │ MAP_FIXED         │ Interpret addr exactly. │
                                      └───────────────────┴─────────────────────────┘

       It is implementation-defined whether MAP_FIXED shall be supported.  MAP_FIXED shall be supported  on  XSI-con‐
       formant systems.

       MAP_SHARED and MAP_PRIVATE describe the disposition of write references to the memory object. If MAP_SHARED is
       specified,  write references shall change the underlying object. If MAP_PRIVATE is specified, modifications to
       the mapped data by the calling process shall be visible only to the calling process and shall not  change  the
       underlying  object.   It is unspecified whether modifications to the underlying object done after the MAP_PRI‐
       VATE mapping is established are visible through the MAP_PRIVATE mapping. Either MAP_SHARED or MAP_PRIVATE  can
       be specified, but not both. The mapping type is retained across fork().

[...]

$ man 2 mmap
mmap(2)                                          System Calls Manual                                          mmap(2)

NAME
       mmap, munmap - map or unmap files or devices into memory

LIBRARY
       Standard C library (libc, -lc)

SYNOPSIS
       #include <sys/mman.h>

       void *mmap(void addr[.length], size_t length, int prot, int flags,
                  int fd, off_t offset);
       int munmap(void addr[.length], size_t length);

       See NOTES for information on feature test macro requirements.

DESCRIPTION
       mmap()  creates  a  new mapping in the virtual address space of the calling process.  The starting address for
       the new mapping is specified in addr.  The length argument specifies the length of the mapping (which must  be
       greater than 0).

[...]

       MAP_PRIVATE
              Create a private copy-on-write mapping.  Updates to the mapping are not visible to other processes map‐
              ping the same file, and are not carried through to the underlying  file.   It  is  unspecified  whether
              changes made to the file after the mmap() call are visible in the mapped region.
The MAP_PRIVATE flag tells mmap to “Create a private copy-on-write mapping”. This is a key phrase. Without getting into the weeds of what copy-on-write (COW) entails, this point means that each process’ call to map libc will share the same physical memory. There is no coordination needed between processes, nor any special kernel mechanism to support shared libraries.
: Wait, so it is magic?
Operating systems sure are magic.
By exercising your curiosity, we have quickly reached the frontier of how libraries get loaded. The fun part of diving into everyday things is you find out that everything is created by real people. I find it immensely rewarding to learn about the history behind how these abstractions have developed. The mmap docs give us a glimpse into kernel lore.
RATIONALE
       After considering several other alternatives, it was decided to adopt the mmap() definition found in SVR4  for
       mapping  memory objects into process address spaces. The SVR4 definition is minimal, in that it describes only
       what has been built, and what appears to be necessary for a general and portable mapping facility.

       Note that while mmap() was first designed for mapping files, it is actually a general-purpose  mapping  facil‐
       ity. It can be used to map any appropriate object, such as memory, files, devices, and so on, into the address
       space of a process.
Instructor: Cool. You know what the docs claim about
mmap, but what sequence of instructions actually run to support sharing?
Kernel Sourcerers
Ooh let’s look at source code. We are still in the realm of theory and haven’t proved our ideas are what gets run.
This source code explanation is a bit dry. Feel free to skim to the next section.
Instead of pulling the latest kernel, I like using a web search such as livegrep or Elixir bootlin. We want to find the entrypoint of calling the mmap syscall. Searching “mmap” does not get anywhere. Stackoverflow tells us to look for sys_mmap or the macro which defines syscalls 8.
SYSCALL_DEFINE6(mmap, unsigned long, addr, unsigned long, len,
		unsigned long, prot, unsigned long, flags,
		unsigned long, fd, unsigned long, off)
{
	if (offset_in_page(off) != 0)
		return -EINVAL;

	return ksys_mmap_pgoff(addr, len, prot, flags, fd, off >> PAGE_SHIFT);
}
The GitHub symbols panel makes it easy to find definitions and references of symbols. GitHub reveals the definition of ksys_mmap_pgoff is in mmap.c.
The filename indicates we are in the right place. A manual inspection of this file shows us that the core logic is in do_mmap. Here we have a source code comment telling us the exact mechanics of what is happening. It fills in some of the implementation details.
/**
 * do_mmap() - Perform a userland memory mapping into the current process
 * address space of length @len with protection bits @prot, mmap flags @flags
 * (from which VMA flags will be inferred), and any additional VMA flags to
 * apply @vm_flags. If this is a file-backed mapping then the file is specified
 * in @file and page offset into the file via @pgoff.
 * [...]
 */
unsigned long do_mmap(struct file *file, unsigned long addr,
			unsigned long len, unsigned long prot,
			unsigned long flags, vm_flags_t vm_flags,
			unsigned long pgoff, unsigned long *populate,
			struct list_head *uf)
{ [...] }
if ((prot & PROT_READ) && (current->personality & READ_IMPLIES_EXEC))
		if (!(file && path_noexec(&file->f_path)))
			prot |= PROT_EXEC;

	/* force arch specific MAP_FIXED handling in get_unmapped_area */
	if (flags & MAP_FIXED_NOREPLACE)
		flags |= MAP_FIXED;

	if (!(flags & MAP_FIXED))
		addr = round_hint_to_min(addr);

	/* Careful about overflows.. */
	len = PAGE_ALIGN(len);
	if (!len)
		return -ENOMEM;

	/* offset overflow? */
	if ((pgoff + (len >> PAGE_SHIFT)) < pgoff)
		return -EOVERFLOW;

	/* Too many mappings? */
	if (mm->map_count > sysctl_max_map_count)
		return -ENOMEM;
You can see all this function does is a lots of permission checking. Here we find the source of truth for the MAP_PRIVATE flag9.
	case MAP_PRIVATE:
			if (!(file->f_mode & FMODE_READ))
				return -EACCES;
			if (path_noexec(&file->f_path)) {
				if (vm_flags & VM_EXEC)
					return -EPERM;
				vm_flags &= ~VM_MAYEXEC;
			}

			if (!file->f_op->mmap)
				return -ENODEV;
			if (vm_flags & (VM_GROWSDOWN|VM_GROWSUP))
				return -EINVAL;
			break;
code after permissions checking
	addr = mmap_region(file, addr, len, vm_flags, pgoff, uf);
	if (!IS_ERR_VALUE(addr) &&
	    ((vm_flags & VM_LOCKED) ||
	     (flags & (MAP_POPULATE | MAP_NONBLOCK)) == MAP_POPULATE))
		*populate = len;
	return addr;
}
I follow this technique to trace functions. I sequentially find the definition of referenced symbols, recursively searching within as needed. Once you find a function, tracing backwards from the return code helps to reduce the irrelevant code to sift through.
We repeat tracing the function calls mmap_region ⟶ __mmap_region
/**
 * mmap_region() - Actually perform the userland mapping of a VMA into
 * current->mm with known, aligned and overflow-checked @addr and @len, and
 * correctly determined VMA flags @vm_flags and page offset @pgoff.
 *
 * This is an internal memory management function, and should not be used
 * directly.
 *
 * The caller must write-lock current->mm->mmap_lock.
 *
 * @file: If a file-backed mapping, a pointer to the struct file describing the
 * file to be mapped, otherwise NULL.
We can ignore the details about virtual memory; the full details of Linux Virtual Memory Areas are in this document. We are focusing on tracing the path to loading the backing library file. If you continue tracing you will get stuck. How is the file never actually used in any of this code? This dead end demonstrates why looking at real code gets complicated. We need to first understand what we are looking at.
Linux tries to be as fast as possible. It will not load data from disk unless necessary. Thus, this mmap call is a lie. It is not loading any files. The kernel simply sets up page table entries for the virtual memory space.
Instructor: Can you think about how the OS would know when it has to load a page in?
The OS can rely on the hardware generating a page fault when the user tries to access this unloaded memory. The OS marks the page table entries as invalid, which causes the hardware to generate a fault. This execution transfer allows the OS to inspect what it should do in response, such as loading the backing memory or killing the process with a segmentation fault.
You might guess that we need to look at the logic on a page fault of one of these addresses. Inside of arm64’s do_page_fault we see where the memory mapping code gets called
static int __kprobes do_page_fault(unsigned long far, unsigned long esr, struct pt_regs *regs) { [...] fault = handle_mm_fault(vma, addr, mm_flags | FAULT_FLAG_VMA_LOCK, regs);vm_fault_t handle_mm_fault(struct vm_area_struct *vma, unsigned long address, unsigned int flags, struct pt_regs *regs) { [...] ret = __handle_mm_fault(vma, address, flags);static vm_fault_t __handle_mm_fault(struct vm_area_struct *vma, unsigned long address, unsigned int flags) {
Are you getting a hang of it? The high quality kernel code makes it easy to explore and pick up their naming conventions. For example, do_ functions do the work, sys_ and SYSCALL_DEFINE help you find where syscalls enter, and __function_name functions are internal functions that implement core logic and get called after all permission checks. Reading unfamiliar code is difficult, but you can follow the same process we have been using: recursively explore function definitions until you understand what the acronyms are, what functions do, and what the jargon means in context.
Going back to __handle_mm_fault, you will realize these function calls are not relevant. They have to do with unrelated unhappy paths that can get hit on a page fault. At a high level, this code walks and allocates the multi-level page table.
static vm_fault_t handle_pte_fault(struct vm_fault *vmf)
{
 [...]

	if (!vmf->pte)
		return do_pte_missing(vmf);

	if (!pte_present(vmf->orig_pte))
		return do_swap_page(vmf);

	if (pte_protnone(vmf->orig_pte) && vma_is_accessible(vmf->vma))
		return do_numa_page(vmf);
Now the fault must get handled. The backing memory must become valid before the OS can return to the faulted program. In our case, the address that faulted is inside libc, which needs to be placed into our process’ address space from disk.
Overview of Page Fault Execution Flow
- Check if the Page Middle Directory (PMD) is present.
- If the Page Middle Directory (PMD) entry is missing, it means there is no page table yet. If the PTE is empty (
pte_none()), then the page is not allocated yet, so we will handle it as a missing page.- Get or allocate a Page Table Entry (PTE). Determine the type of fault and handle it accordingly:
- Page is missing → Allocate a new page (
do_pte_missing()).- Page is swapped out → Swap it back in (
do_swap_page()).- Page migration/NUMA fault → Handle it (
do_numa_page()).- Write protection fault → Handle copy-on-write (COW) (
do_wp_page()).- Otherwise, mark the page as accessed and dirty if needed.
When the faulted page is missing or swapped out, the execution path continues as follows:
- Page is missing →
do_pte_missing()
- If the mapping is anonymous, a new page is allocated.
- If the mapping is file-backed, the function calls
filemap_fault()to fetch data from disk.- File-backed page →
filemap_fault()
- If the page is not in memory, it requests disk access via the block layer.
- Disk access happens via the filesystem & block layer
- The requested page is fetched from disk into the page cache. Once loaded, the page is mapped and execution continues.
⟶ We fall into
do_pte_missingbecause the page for this mmap has not been created nor has the file been loaded.This page is not a normal stack or heap page, so we need to do work to load the file.
⟶
do_faultThe code branches on the types of faults ⟶ This is a
do_read_fault⟶__do_fault
This leads to a function pointer for the exact fault handler we want to use for this filesystem
This layer of indirection (VFS) allows the implementation to be general for the exact filesystem in use.
ret = vma->vm_ops->fault(vmf);
The types help us figure this out struct vm_fault ⟶ vm_area_struct ⟶ vm_operations_struct
Bingo. We now know what the type of fault is: vm_fault_t (*fault)(struct vm_fault *vmf);.
Although we have hit a dead end, applying the same exploration tricks gets us to filemap_fault. grep finds us many definitions, but we can choose the ext4 filesystem as an example. We can use the types to find this does nothing other than call the generic implementation of filemap_fault. Yet again, the comments on the function are extremely helpful and let us confirm we are in the right place.
Let’s update our snapshot of our current understanding.
Summary of Execution Path
- The kernel walks the page table in
__handle_mm_fault(). This generates a page fault.- A missing file-backed page triggers
handle_pte_fault().- It calls
do_pte_missing(), which routes to do_fault().do_fault()identifies the fault as a read fault and callsdo_read_fault().- This invokes
vma->vm_ops->fault(), which for files isfilemap_fault().filemap_fault()checks if the page is in the page cache.
- If present → Map it into the process and return.
- If missing → Request disk I/O via the block layer[^2].
- The page is read from disk into the page cache.
- The process blocks while the page is mapped, and execution resumes.
This looks much more precise than before! We can continue recursively unfolding function defintions. There is a call to filemap_get_folio which returns a folio type. The type’s comment indicates something interesting. Both the filesystem function and this function mention a “page cache”
 * A folio is a physically, virtually and logically contiguous set
 * of bytes.  It is a power-of-two in size, and it is aligned to that
 * same power-of-two.  It is at least as large as %PAGE_SIZE.  If it is
 * in the page cache, it is at a file offset which is a multiple of that
 * power-of-two.
A folio is a reference counted page cache entry. We are loading a new file for the first time, so this page will not be in the page cache.
Instructor: Or will it?
What file are we loading again? We are loading libc. Effectively, every program is using libc. This file will surely be in memory already. Alas, this file is in use by other processes, so we cannot reuse the file.
Instructor: Or can we?
Let’s look back at the syscall we are executing in the first place. Take a look at the flags. We only want to execute libc. Thus, every program can share the same read-only copy of this physical memory mapped into their virtual address spaces.
This is magic. There was no coordination between the programs reading this same file. No special mechanisms are used in the kernel. The same ideas that support virtual memory are working in harmony to make dynamic library loading invisibly work.
Now, let’s follow the path when a file-backed page is missing and needs to be read from disk.
Hardware tries to access an uninitialized page
⟶
handle_pte_fault(): If the page is not present, it callsdo_fault().⟶
do_fault(): If the mapping is from a file, it callsfilemap_fault().⟶
filemap_fault(): This function tries to load the missing page from disk. It callspage_cache_read()if the page is not already cached.⟶
page_cache_read()Reads the page from the filesystem’s page cache. If the page is not cached, it requests disk access via the block layer.
There you have it! The library has been mapped into the process from the cache. Our process can continue running with shared libraries, oblivous to all this work the kernel has done in the background. Yet, the kernel did not do anything special to support this one library sharing use case! Every kernel action was on behalf of a user syscall.
Recap
The solution is elegant: there is no special “dynamic linking” support in the kernel.
These general purpose mechanisms are used:
-
mmap()withMAP_PRIVATEcreates copy-on-write mappings - Page faults trigger on-demand loading
- The page cache automatically shares identical file content between processes
- Virtual memory lets each process see libraries at different addresses while sharing the same physical memory
At a high level: 
More precisely: 
It’s for the pedagogy 10
: Holupaminnit, how did we get to
printfand page faults? I thought we were talking about loading binaries?
Alas, I have tricked you into learning something new. One way to ask this question is to ask what happens when there is a printf in your code, but I think the framing of our initial question at the start led us along a more interesting route.
Undoubtedly, there are many other aspects of loading a program I have skipped. The point to take home is that exploration is nonlinear. All the irrelevant things we tried while inspecting system behavior turned out to be completely relevant! There is a lot going on, but I hope you will believe me and believe yourself that you could have figured this out. The approach we took for figuring this puzzle out is great because it works in general. For kernel code, the better approach is probably to go directly to kernel documentation and to start reading the source code. However, documentation is not enough to see what precisely happens beneath the hood and make changes.
What we didn’t cover
Think about these for yourself.
- Can you write a C program to test your mental model? Can you spelunk your kernel to find out? Remember, just because LLMs act authoritative, it does not mean they know anything.
- How do we know when a program has finished executing? What does it mean to be the last instruction of the file?
- How does
printfactually work. This post is supremely interesting. I love the presentation of the post and it goes into much more detail than I get into here. If you think you can explain howprintfworks, the author will humble you. - We stopped at the assembly level, but how is each of these instructions actually executing? What hardware is involved? What is the hardware doing?
- Can you have multiple versions of the same library installed?
- If you remove the
returnstatement inhello_world.c, can you explain why the program returns13? Hint: what does thevoidkeyword mean? Where are return values stored? - Why does a simple program with no library calls, such as addition, still load
libc? Hint: try looking at the output ofstrace. What is the last system call called by the program? - Can you figure out what dynamic library an address belongs to in the virtual address space of a program on your computer?
$ cat /proc/$(pidof binary_name)/maps. What is the program being run? You should be able to tell from the sections.
You now have all the tools to learn anything you want. To keep this knowledge, you must exercise it. I leave you with a quest: embark on your personal journey of Linux spelunking and discover what happens when you start running a program with the exec syscall. You can find a sample solution in the “The exec Functions” section of Understanding the Linux Kernel. The “How programs get run” series by LWN also has a great explanation (part 1, part 2).
Wrapping up
In this post, we demystified how Linux loads processes and discovered how Linux works on a journey that reminds me of the joys of computers and discovery.
The great part about learning things this way is that you feel empowered to learn anything. The power of open source allows us to figure absolutely anything out with enough effort. We also do not need to trust anything. We looked at the source ourselves and can be quite confident that we have created a mental model accurate to the real world.
This post was inspired by this video on Linux signals. It is one of the best videos I have ever seen. I rewatch it every few months to remind myself how beautiful it is to be able to understand these precise and complex beasts which are the machines we use. I hope you can appreciate the beauty of the ridiculous world we live in. All it takes is a sense of wonder and you can build anything.
Thank you for reading! This article took me 49 hours over 8 weeks. I have surely gotten details wrong in the post. I am sorry. Point them out! Please email me any feedback at process-loading <at> this domain or leave it in the comments below.
The objective is curiosity maximization. Happy exploring.
Further Reading:
- Best resource I have found on shared libraries: How To Write Shared Libraries by Ulrich Drepper
- Dynamic linker wiki
mmapwiki- How statically linked programs run on Linux (and how you get from libc to the start symbol)
- Understanding Linux ELF RTLD internals
- GOT and PLT for pwning
-
man ld.so: Describes in detail all the places dynamic libraries come from and how you indicate what gets loaded.-
lddtrivia: it has arbitrary code execution as it may run the target binary
-
- Try compiling some files and disassmbling them. Here are some flags to make it more readable.
objdump --disassemble=main --no-show-raw-insn --visualize-jumps --disassembler-color=on a.out | less - “Libraries” part of Understanding the Linux Kernel, 3rd Edition
-
a similar blog post for tracing
ls - Anatomy of a system call part 1, part 2
- You can be a wizard
Resources for filesystem details I glossed over:
- For more details on the exact actions to read from disk, blk layer slides
- An Introduction to the Linux Kernel Block I/O Stack
- How the Linux VFS, block layer, and device drivers fit together
- Linux VFS and Block Layers
- The Generic Block Layer from Understanding the Linux Kernel
- If you want extreme detail on Linux Virtual Memory, there’s an entire book. The “Page Faulting” section is a good supplement to this post.
I tried to make every logical jump explicit as an educational method. When you are debugging for real, you should reach to the best tool for the job instead of the winding path I took. For example, I used vim to open files to show that binary is not scary. You would never look at a binary in a normal text editor like vim–reach directly for objdump or readelf. If high level tools don’t work, then you can use a hex viewer.
Another much faster path to figuring out what a program does is to use a disassembler. We were manually going through the process of a small part of what disassemblers can automatically do for us. This would have shown what hello_world.c is actually doing as something like this
function main {
  puts("Hello world!");
  exit(0x0);
  return;
}
Of course, there is a lot more code running. You can use a full-fat disassembler such as Ghidra. This dogbolt web disassembly of a hello world program is enough to get an idea of what the output looks like.
The code I ran is available at godsped.com/files/{explore_plt.c, hello_name.c, hello_name.strace, hello_world.c, hello_world_skeptic.c, hello_world.strace}. ↩
A good POV of the debugging mental model ↩
It’s conventionally called
_start, but in reality the initial point of execution is determined by the entrypoint of the (ELF) header. Further reading: one, two. ↩The system you are using probably resolves all symbols at startup so that GOT overwrite attacks cannot happen. This security feature is called Full RELRO and is enabled by the
BIND_NOWflag. ↩It’s the exact same! Having a file start with the bytes
#!indicates that the file should be interpeted as a script. I’ll keep hammering the point home. Everything is only bits at the end of the day. An executable is not different than other files stored on your disk. Let’s take this idea to the extreme: you can write an executable directly in a text editor. ISN’T THAT CRAZY? Kay Lack has a beautiful video demonstrating manually writing an ELF file and Steve Chamberlin has a great blog post where he does this on Windows. ↩Image from Win32 API Programming with Visual Basic by Steven Roman page 212. ↩
footnote: path to finding this is using this post https://stackoverflow.com/questions/14542348/how-to-find-a-definition-of-a-specific-syscall-in-linux-sources and then use regex “.” syntax to find the definition of mmap ↩
If you have used Nachos or are only familiar with using
read/writewith files, you may get confused bymmapsemantics.mmapdoes copy data from disk to memory, but if the process does not modify the data, then the physical pages can be shared. Technically, sharing libraries does require this much kernel support. ↩